Back to work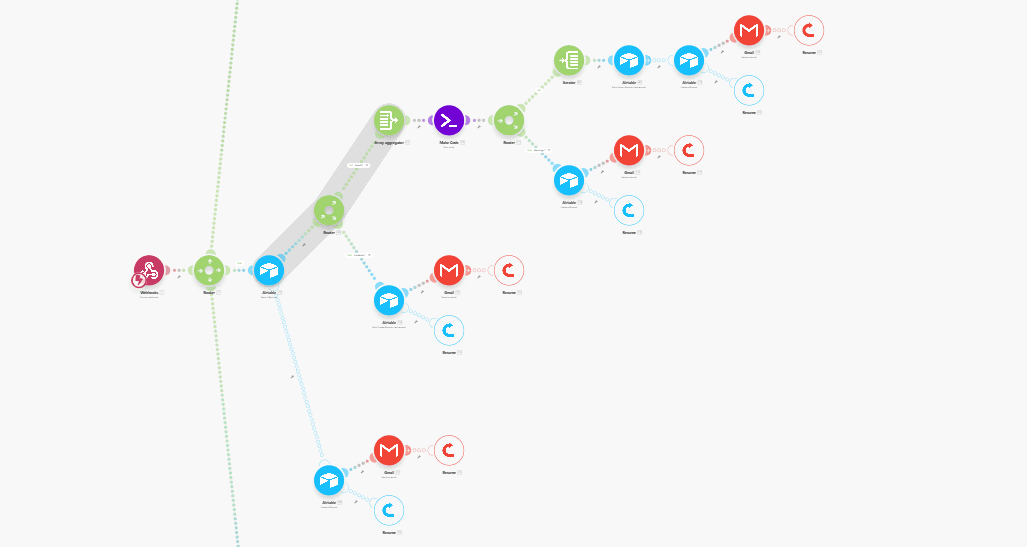
ai2025
Reporting & Dashboard Automation
Cross departmental KPI automation replacing multi day manual reporting with a single button click.
Make.comAirtableGoogle SheetsGmail
Overview
An automated reporting workflow that consolidates performance data from Sales, Project Delivery, and People Operations into a single Airtable dashboard with realtime visibility.
Problem
Each department tracked metrics in separate systems. End of cycle reporting required manual data gathering, KPI calculation, and dashboard updates, error prone, slow, and unscalable.
Solution
I designed a Make.com automation triggered from Airtable that pulls data from Google Sheets and multiple Airtable bases, calculates KPIs, and updates a central dashboard with error handling.
- 1.Trigger via a single “Update Metrics” button in Airtable.
- 2.Pull Sales data from Google Sheets and ops data from Airtable bases in parallel.
- 3.Calculate KPIs: revenue, completion rates, employee growth metrics.
- 4.Update central Airtable dashboard with charts and department filters.
- 5.Log errors and continue with available data if a source is unavailable.
Impact
Reporting that took several days now completes in under three minutes with built in error handling.